Building a Production Monitoring Stack from Scratch — Part 2: Grafana Alloy & the Push vs Pull Problem
Series: From NagiosXI to a Modern Observability Stack Part 2 of 4
The Open Question from Part 1
By the end of Phase 1, the stack was working. But Node Exporter is a single-purpose binary — host metrics, nothing else. The plan was always to get logs and traces into the same system, which meant we'd eventually need more agents on each host. A separate exporter for postgres metrics, another for nginx, maybe more after that. Each one is another thing to deploy, another thing to update, another thing to break in a subtly different way.
My colleague and I had been running in parallel on this. He was working through the multiple-exporter approach — the established path, a separate binary per signal type. I'd been looking at Grafana Alloy, which promised a single agent that could handle metrics, logs, and traces from one deployed process.
The question was whether Alloy was actually ready to build on.
What Alloy Is
Grafana Alloy is Grafana Labs' open-source observability agent, positioned as the successor to Grafana Agent Flow. It's built around a pipeline model: you define sources, processors, and exporters as typed components and wire them together in .alloy config files.
When I started working with it, it was still fairly new. The Agent Flow rebranding into Alloy had just stabilised, documentation was still filling in gaps, and community examples were sparse. You were going to hit sharp edges. But the direction seemed clearly right — one agent, multiple signals, explicit pipelines.
What made it compelling on paper:
prometheus.exporter.unixreplicates Node Exporter's collectors without a separate binary- First-class support for OpenTelemetry receivers and exporters
- Composable pipeline configs where data flow is visible and readable
- Application metric endpoints (postgres, nginx, etc.) accessible as pipeline components
The config model is clean. Here's a simple pipeline — collect host metrics, send to Prometheus:
prometheus.exporter.unix "localhost" {
  set_collectors = ["cpu", "meminfo", "diskstats", "filesystem", "netdev", "loadavg"]
}

prometheus.scrape "node" {
  targets    = prometheus.exporter.unix.localhost.targets
  forward_to = [prometheus.remote_write.default.receiver]
}

prometheus.remote_write "default" {
  endpoint {
    url = "http://prometheus:9090/api/v1/write"
  }
}
That remote_write line introduced a problem I didn't see coming.
The Push vs Pull Problem
Prometheus is a pull-based system. It owns the scrape cycle — it reaches out to targets, pulls metrics, and as a side effect of each successful scrape, generates a synthetic up metric:
up = 1— scrape succeeded, host is reachableup = 0— scrape failed, something is wrong
up isn't something your application exports. Prometheus generates it internally, based on whether the HTTP request to /metrics succeeded. The entire alerting chain from Part 1 depended on it.
When Alloy uses prometheus.remote_write, the data flow reverses. Alloy pushes metrics to Prometheus via HTTP POST. Prometheus sits passively and receives what's sent.
And that means Prometheus never scrapes these hosts. So Prometheus never generates up for them.
The first time I checked the Prometheus targets page after switching to push-based Alloy, those hosts weren't in the targets list at all. Not showing up = 0 — not there at all. Prometheus had no scrape config for them; it was just receiving a stream of metrics it hadn't asked for. The up metric had silently disappeared, and everything built on top of it — every alert, every "host is down" notification — had gone with it.
This was the kind of failure that wouldn't surface immediately. The dashboards still had data. Metrics were still flowing. It would only become obvious the next time a host actually went down and nobody got paged.
The Workarounds I Tried
Heartbeat metric from Alloy's internal health
Alloy exposes internal component status metrics. You can check if the pipeline is running. But this only tells you Alloy is alive on the server side — it says nothing about whether the host is reachable. A host could be completely unreachable and Alloy's own health metrics would look fine from Prometheus's perspective, because Prometheus was never reaching out to check.
Staleness detection via timestamp
If a host stops pushing, its metrics go stale. You can detect this:
(time() - max by (instance) (timestamp(node_cpu_seconds_total))) > 120
This technically works. But it's fragile — dependent on a specific metric being present and recently written, prone to false positives from remote_write buffer lag or brief network hiccups. And it means rewriting every alert and dashboard around staleness rather than the clean binary up signal. It felt like building on sand.
The Actual Fix
After long enough on the workarounds, the right answer was simpler: keep Prometheus pulling, just pull from Alloy's HTTP endpoint instead of a standalone Node Exporter binary.
Alloy exposes an HTTP API on port 12345. Every component that produces metrics is accessible at a path under that API:
http://<host>:12345/api/v0/component/prometheus.exporter.unix.localhost/metrics
This is a plain HTTP endpoint serving Prometheus text format — exactly what Node Exporter served on port 9100. Prometheus can scrape it exactly like any other target. When it does, it generates up. Everything from Part 1 works without modification.
The Alloy config on each host becomes simpler, not more complex — no prometheus.scrape, no prometheus.remote_write:
prometheus.exporter.unix "localhost" {
  set_collectors = [
    "cpu",
    "meminfo",
    "diskstats",
    "filesystem",
    "netdev",
    "loadavg",
    "uname",
    "time",
    "systemd",
    "processes",
  ]
}

// Prometheus will pull from:
// http://<host>:12345/api/v0/component/prometheus.exporter.unix.localhost/metrics
The target file for each Alloy host points to port 12345 and uses __metrics_path__ — a special Prometheus label that overrides the default /metrics scrape path — to point at the correct component endpoint:
[
  {
    "targets": ["10.200.3.23:12345"],
    "labels": {
      "hostname": "cloud-network-3",
      "environment": "production",
      "maintainers": "admin@domain.com",
      "__metrics_path__": "/api/v0/component/prometheus.exporter.unix.localhost/metrics"
    }
  }
]
Prometheus scrapes it, gets back standard metrics, generates up = 1, stores everything as normal. The alerting chain is intact.
Getting Application Metrics In: The Part That Nearly Broke Alloy for Us
The unix exporter was the straightforward part. The harder part was getting application-level metrics — specifically postgres and nginx — through Alloy rather than through separate exporter binaries.
Alloy has built-in components for both. The postgres one:
prometheus.exporter.postgres "db" {
  data_source_names = ["postgresql://user:pass@localhost:5432/mydb?sslmode=disable"]
}
I tried the nginx equivalent first. Alloy has prometheus.exporter.nginx, which connects to nginx's stub_status endpoint and pulls metrics from it. I set it up, checked the output — nothing. No metrics, no errors, just silence. I spent time on it, checked the nginx config, checked the Alloy config, tried different approaches. At some point I started thinking seriously about just installing the standalone nginx exporter and giving up on Alloy for application metrics entirely.
Before doing that, I tried the postgres component instead. It worked immediately — metrics flowing through on the first attempt. That was the signal I needed. If postgres worked, nginx should work too. The problem wasn't Alloy. Something was wrong with my specific nginx setup.
I went back to nginx, looked more carefully at the stub_status configuration, and found it. The endpoint wasn't properly enabled — the nginx config had the stub_status block but it was only accessible from 127.0.0.1, and Alloy was trying to reach it in a way that wasn't matching that restriction. A small fix, and nginx metrics started flowing.
The near-ditch was worth it. Running separate exporters for every application would have meant my colleague's approach and my approach converging on the same place — a proliferation of binaries per host. The whole point of Alloy was avoiding that.
Why Alloy Over Multiple Exporters
My colleague's multiple-exporter approach was working. It's the established path, well-documented, stable. The case for it isn't wrong.
But the case for Alloy is better for where we're going. The moment you want logs — which was always the plan — you need another agent anyway. If you're already running Node Exporter, postgres exporter, and nginx exporter, you're at three binaries per host. Adding a log agent makes four. Each one needs to be deployed, configured, updated, and monitored independently.
With Alloy, adding logs is another component in the same config file on the same process. Adding traces is the same. The operational footprint stays at one agent per host regardless of how many signals you're collecting.
There's also the matter of the pipeline model. When you have a single config that describes exactly what data is flowing where, debugging is straightforward. With four separate agents running independently, understanding the full picture requires checking four separate processes.
The sharp edges were real — the push vs pull problem cost me real time, the nginx issue nearly derailed the whole approach. But those were solvable problems. The structural limitation of multiple exporters — complexity that compounds as you add signals — isn't.
What Changed in Grafana
prometheus.exporter.unix uses the same metric names as standalone Node Exporter — it's built on the same underlying collectors. Every PromQL query from Part 1 works unchanged.
The one real change is how up is queried. With Alloy, the job label becomes "alloy", and filtering is done through the richer label set on each target — environment, priority, instance — rather than anything tied to a port or exporter binary. For example, the fleet status panel:
count(up{job="alloy", priority=~"${priority}", environment=~"${environment}", instance!~"^localhost.*", instance=~"${instance}"} == 1) or vector(0)
The or vector(0) ensures the panel returns zero rather than no data when nothing matches — a small thing that matters when you're staring at a dashboard at 2am wondering if the query is broken or the hosts are genuinely all down.
Where This Left Off
By the end of Phase 2, the stack had a single agent per host handling metrics across system and application layers, pull-based scraping preserved so all the alerting machinery from Phase 1 still worked, and OTel ports open on the Alloy container for what came next.
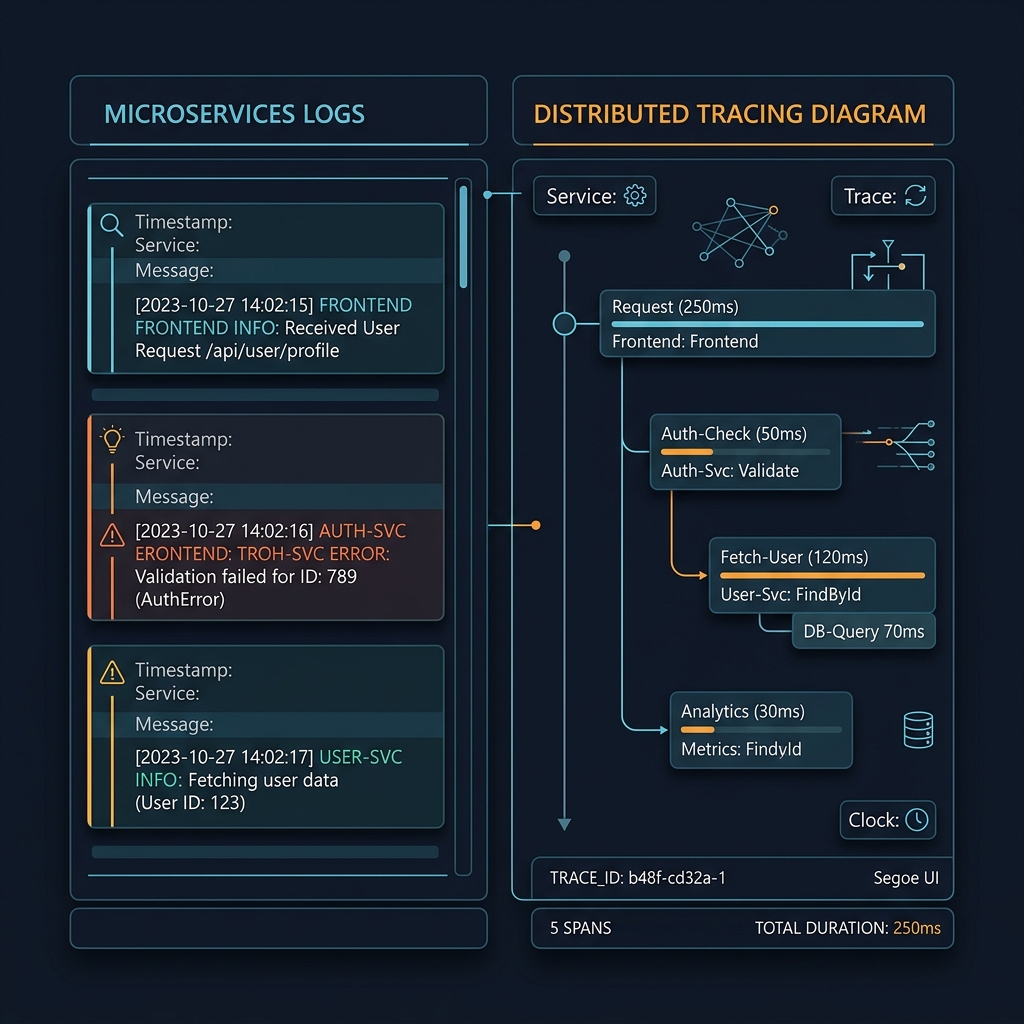
The next gap was observability beyond metrics. Host CPU and memory tell you a machine is struggling; they don't tell you why, or what a request was doing when it failed. That meant Loki for logs and Tempo for distributed traces.
Next: