Building a Production Monitoring Stack from Scratch — Part 4: The Enrollment API
Series: From NagiosXI to a Modern Observability Stack Part 4 of 4

The Remaining Friction
Three parts in, the monitoring stack was complete in terms of capability. But adding a new host still looked like this:
- SSH onto the host
- Install Grafana Alloy
- Write the Alloy config for that host's specific services
- Start the service
- Write a Prometheus target JSON file with the host's full metadata
- Place that file in the targets directory on mon-node-a
- Reload Prometheus
- Verify the host appeared in Grafana
At ten hosts this is manageable. We were heading toward significantly more than ten, across different subnets, different OS versions, different service combinations. Each enrollment was a context switch — SSH session, config writing, file placement — and each one was another opportunity for a typo in a label that would surface as a confusing gap in a dashboard weeks later.
The obvious answer was automation. The question was what form it should take.
Why Not Ansible
Ansible was the straightforward choice. Write a playbook, run it against a host, done. It's what most teams would reach for.
The problem was the operational model it would create. A playbook lives in a repository. Adding a host means committing a vars file, or updating an inventory, pushing to a repo, waiting for a pipeline. Secrets need to be encrypted, which means setting up Vault or ansible-vault, wiring that into CI, making sure anyone who needs to enroll a host has access to the right keys. You've traded one kind of manual work for another.
It also meant the monitoring stack would have an external dependency — a separate repository, a CI system — just to add a host to Prometheus. If the pipeline was down, enrollment was blocked.
What I wanted was something self-contained that lived with the monitoring stack and could be used by anyone with access to Grafana, without needing to touch a repository or understand the underlying infrastructure.
The Grafana Plugin Insight
Grafana has a plugin system. You can build a custom frontend that installs directly into Grafana as a panel or app, with its own pages, its own navigation, its own UI. It appears in the sidebar alongside Dashboards and Alerting as if it were a native part of the product.
That was the piece that made the whole thing click. If I built an enrollment API and a Grafana plugin that called it, the entire workflow would live inside the tool the team was already using. No separate app to navigate to, no CLI to remember. Just a form in Grafana: fill in the host details, submit, host is monitored.
I'd built APIs in Python before and had experience writing Python to SSH into hosts and execute commands — that background came from working on a CD pipeline from scratch. The backend wasn't the unknown part. The Grafana plugin was new territory.
The API
The backend is a Python API. An enrollment request comes in with the host's IP, SSH credentials, the services running on it, and the label metadata to attach to it in Prometheus. The API then:
- Connects to the host via SSH (key or password)
- Detects the OS — Debian, RHEL, SUSE, Windows each have different package managers and service managers
- Installs Grafana Alloy if not present, or validates the existing installation
- Generates an Alloy config appropriate for that host and its services from templates
- Deploys the config and validates it by running
alloy fmton the remote host before restarting the service - Writes the Prometheus target file with the full label set
- Reloads Prometheus via its HTTP API
- Returns a structured response
The validation step — running alloy fmt on the host itself before restarting Alloy — was an early decision that proved its worth. Config template bugs would otherwise surface as a silent Alloy failure: service appears to restart, metrics stop appearing, nothing in the logs that makes the cause obvious. Catching the syntax error before committing to it saved that confusion more than once.
Enrollment is idempotent. Running it against an existing host checks what's already there, updates what's changed, and skips what hasn't. Re-enrolling a host after a template update is a normal operation, not a risky one.
For hosts being decommissioned, the API renames the target file with a .deleted.<timestamp> suffix rather than deleting it. The targets directory ends up as a passive audit trail — you can see every host that was ever enrolled and when it was removed, without digging through logs.
The API also handles batch enrollment — a list of hosts processed concurrently up to a configurable limit, with per-host status tracking so failed hosts can be retried independently.
The Grafana Plugin
The plugin is a Grafana app plugin — it installs into Grafana and adds pages to the sidebar. The enrollment form lives at /grafana/a/iris/enroll. It has fields for connection details, host type, SSH credentials, service configuration, and the label metadata that ends up in Prometheus.
Building a Grafana plugin for the first time meant learning the plugin SDK, understanding how Grafana's frontend architecture works, and figuring out how to wire API calls through Grafana's proxy so the backend isn't exposed directly. None of that was especially difficult, but it was all new, and the documentation for app plugins is thinner than for panel plugins.
The result is that enrollment happens entirely within Grafana. An operator fills in the form, hits submit, and within about 30 seconds the host appears in the fleet dashboard. The underlying SSH, config generation, and Prometheus reload are invisible. The plugin also has pages for viewing enrolled hosts, managing labels, and handling batch enrollments from a file upload.
What Changed
Before the API, enrolling a host was a sequence of manual steps spread across multiple systems. After it, the same operation takes 30 seconds and happens inside the tool the team already has open.
The label consistency improved noticeably. When metadata is entered through a form with defined fields rather than hand-written into a JSON file, the alert annotations and dashboard filters stay clean. No more maintainer vs maintainers label mismatches surfacing weeks later.
The audit trail in the targets directory — active files, deleted files with timestamps — became useful almost immediately. During a network audit, being able to answer "when was this host enrolled and when was it removed" from the directory listing alone, without touching logs or databases, turned out to be genuinely handy.
The API also became the foundation for more. Once you have a reliable programmatic path into the monitoring stack, other things become possible — automated enrollment from infrastructure provisioning, health checks, label updates when service ownership changes. That expansion became its own project.
Closing the Series
The series started with the question of whether an open-source observability stack could genuinely replace NagiosXI in production. By Part 4, the answer was clearly yes — and the result had gone further than parity.
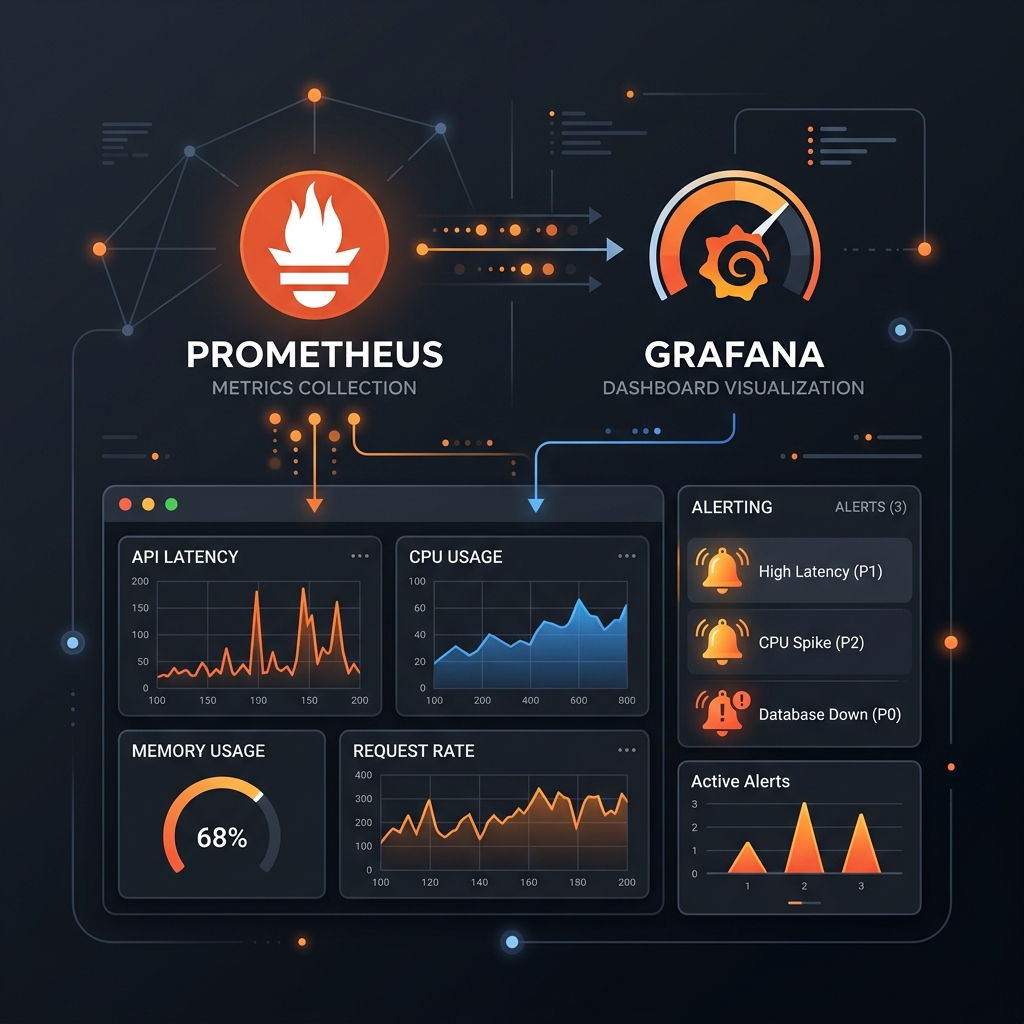
Part 1 — Prometheus, Grafana, Node Exporter, AlertManager. Functional host monitoring, replacing what NagiosXI did.
Part 2 — Grafana Alloy replacing Node Exporter. One agent per host, the push vs pull problem, recovering the up metric.
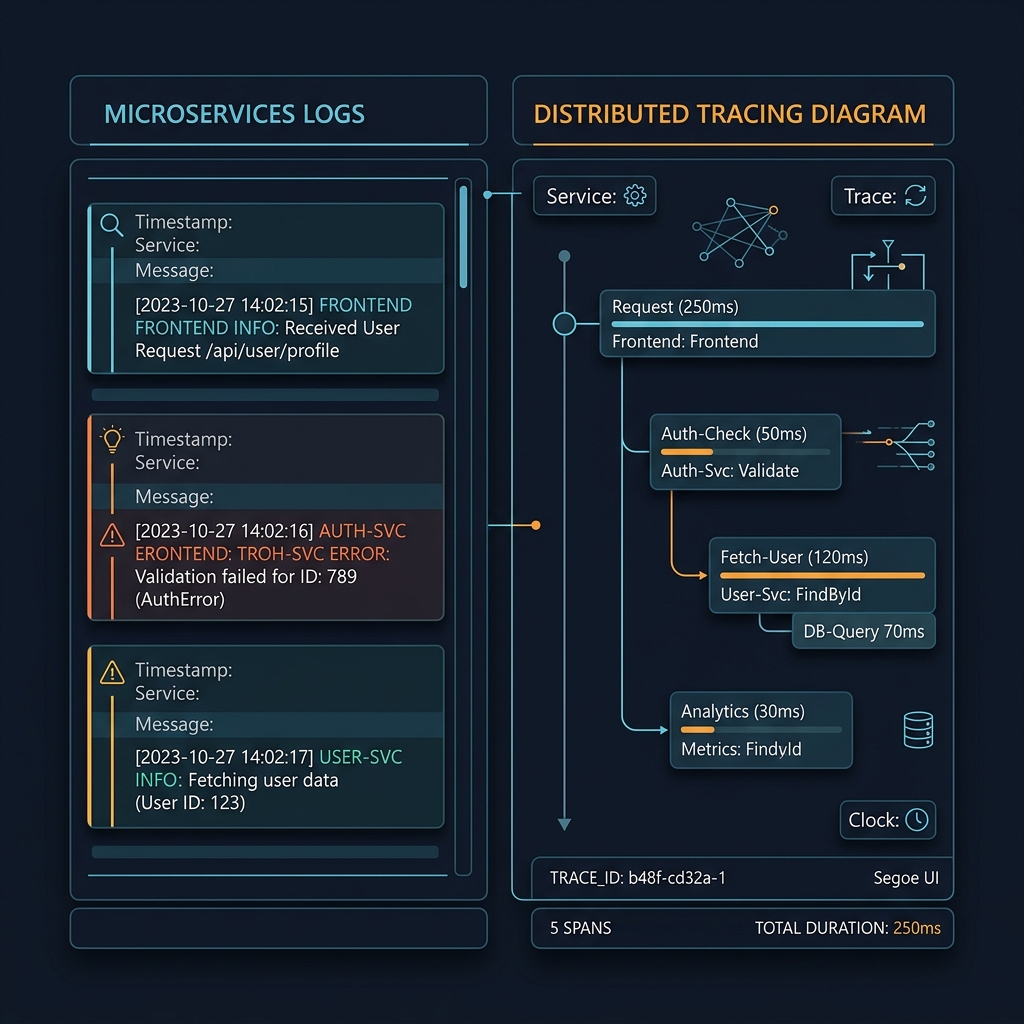
Part 3 — Loki and Tempo. Logs and distributed traces alongside metrics, all queryable from Grafana with signals linked to each other.
Part 4 — The enrollment API and Grafana plugin. The operational friction of adding hosts, eliminated.
The stack covers the full production fleet with metrics, logs, and traces. Alerts are accurate. Enrollment takes under a minute. The whole thing runs on open-source software with no licensing costs.